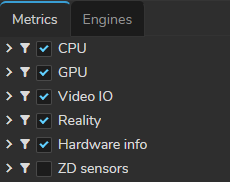
The Metrics subsection allows you to select specific types of metrics to monitor, including:
* CPU
* GPU
* Video IO
* Reality
* Hardware Info
* ZD Sensors
Under each metric type, you can enable and observe various metrics:
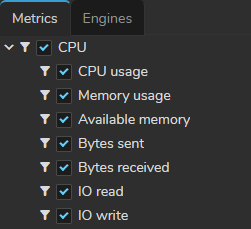
### CPU Metrics
CPU Metrics
* **CPU Usage (%):** Indicates the current percentage of CPU processing power in use. Higher percentages imply heavier workload.
* **Memory Usage (%):** Reflects the percentage of physical RAM in use compared to total available RAM. Higher percentages indicate higher memory usage.
* **Available Memory (MB):** Represents the amount of unused physical RAM available for use. Monitoring ensures sufficient memory for applications.
* **Bytes Sent:** Total bytes sent over the network interface. Crucial for assessing outbound network traffic.
* **Bytes Received:** Total bytes received over the network interface. Essential for monitoring inbound network activity.
* **I/O Read (bytes):** Measures total bytes read from storage devices. Helps evaluate storage performance and data access.
* **I/O Write (bytes):** Indicates total bytes written to storage devices. Essential for evaluating storage performance and data writing patterns.
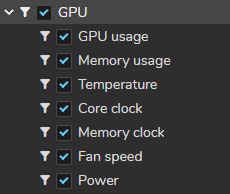
### GPU Metrics
GPU Metrics
* **GPU Usage:** Indicates the percentage of GPU processing power currently in use. Higher percentages imply heavier workload.
* **Memory Usage:** Reflects the percentage of GPU memory (VRAM) in use compared to total available memory. Higher percentages indicate greater memory utilization.
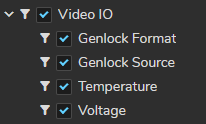
### Video IO Metrics
Video I/O Metrics
* **Genlock Format**: Synchronization signal format for frame synchronization between video devices.
* **Genlock Source**: Device providing the synchronization signal for frame synchronization.
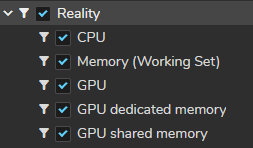
### Reality Metrics
Reality Specific Metrics
* **CPU**: CPU usage and performance metrics specific to Reality applications.
* **Memory (Working Set)**: Memory usage by Reality applications for executing processes.
* **GPU**: GPU usage and performance metrics specific to Reality applications.
* **GPU Dedicated Memory**: Portion of GPU memory allocated exclusively to Reality applications.
* **GPU Shared Memory**: GPU memory accessible by multiple Reality applications.
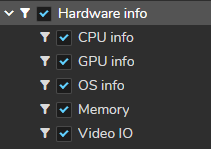
### Hardware Info Metrics
Hardware Info
Hardware Info data will be visible inside the Specs section. For more details about Hardware Info, visit the [Specs](https://zerodensitydocumentation.gitbook.io/docs/reality-5.4/reality-5.4/user-guide/hardware-monitor/specs) section.
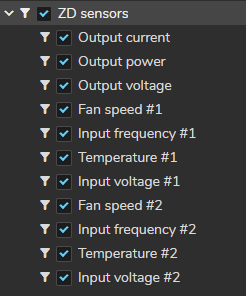
### ZD Sensors Metrics
ZD Sensors shows metrics from Zero Density's in-house advanced sensor systems, included with the Ampere Render Engine EVO2. For more details, please visit our website.