

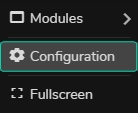
Configuration
Click on the Main Menu and navigate to Modules > Hardware Monitor.
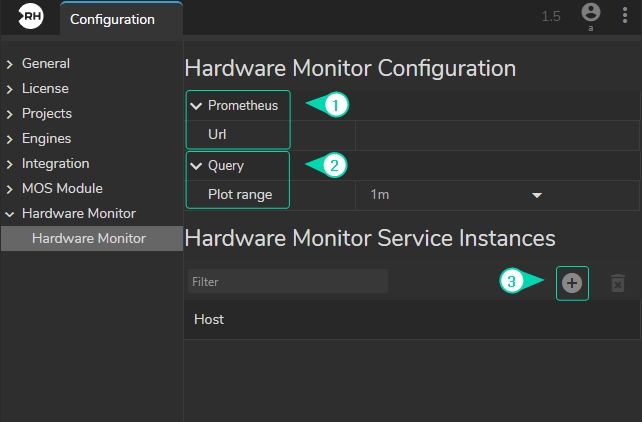
Expand the Hardware Monitor menu on the left panel.
Define a Prometheus URL.
Set a Plot Range Query time.
Add Hardware Monitor Server Instance.
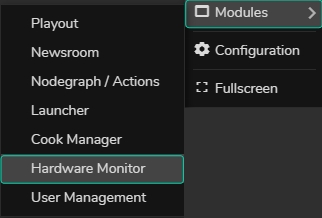
Click on the Main Menu and navigate to Modules > Hardware Monitor.
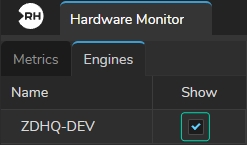
Click on the Engines tab, then click on the Show checkbox.
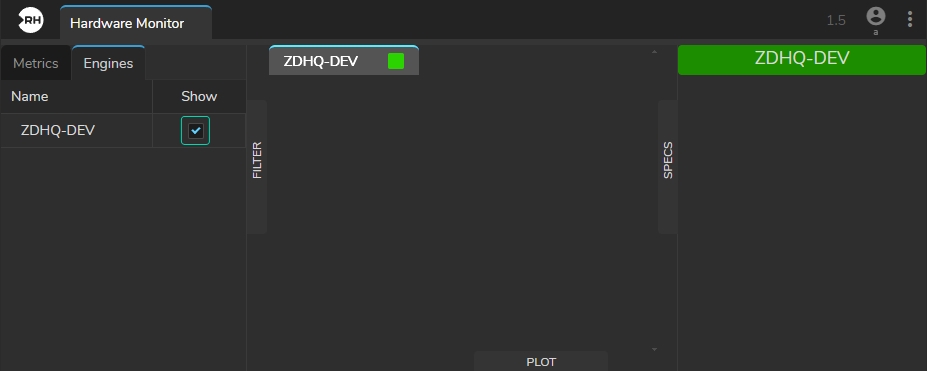
As soon as your Engine is enabled, its hostname also become available in the Metric Display area and Specs section, as shown in the image above.
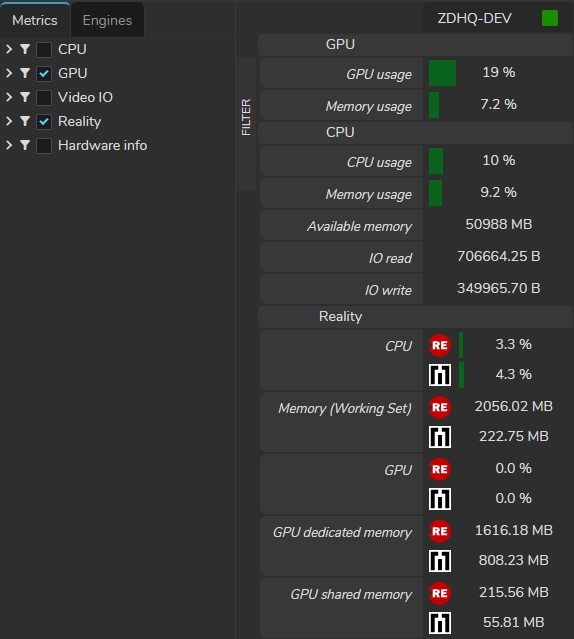
Navigate to the Metrics section and activate one, several, or all of them according to your preference.